
Don’t think for a moment that this week’s volatility in the crypto market signifies the end of it all.
It’s just another week of ebb and flow in the most exciting and emotionally charged market in the world.
As I’ve been saying, this kind of correction is quite normal after such a huge run-up over the past year…
… and it’s entirely healthy.
It’s what markets do when they’ve got ahead of themselves.
And if anything, you should see this kind of correction as an opportunity.
A chance to establish or add to positions in solid cryptos at a far better price than you could have done last week.
But it’s not cryptos I want to talk about today.
I want to talk about something that’s potentially far more significant… with far more serious implications… than this week’s dips and twists in the crypto rollercoaster ride…
This affects far more people than the relatively small group of investors and traders involved with cryptocurrencies.
It concerns the world’s most popular wealth creation mechanism.
Something that’s far more widely used and has a far longer history than bitcoin and cryptos…
But which – despite what headline numbers say – could be at or very close to breaking point.
I’m talking about stock markets…
Record highs ignore the hidden dangers
Stock markets look brilliant right now.
But from what I can see, there are plenty of dangers lurking.
And if people don’t wise up, they’re going to get hurt.
Investors are way too relaxed.
Half-asleep even.
But they need to snap out of it.
Because if they’re not careful, they could end up sleepwalking towards financial disaster.
I can see why it is… why investors have become so complacent.
Stock markets just keep on going up, right?
Have a look at investment news sites and you’ll find plenty about “the market” hitting new record highs.
When they say “the market”, people usually mean the Dow Jones Industrial Average.
That’s an index of 30 major stocks from across the US economy.
It’s kind of the American equivalent of the FTSE 100.
Anyway, on Wednesday, the Dow Jones hit 26,000 for the first time ever and people crowed about that.
Sleepwalking through another milestone
Just like they’ve been crowing about it hitting every 1,000-point milestone over the past two years…
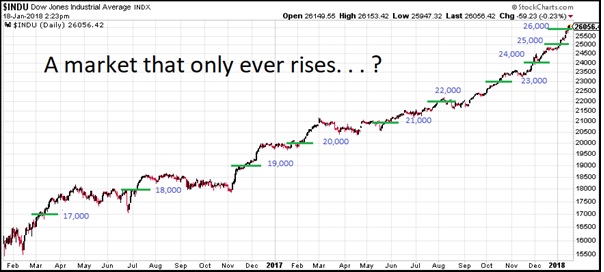
Source: Stockcharts.com
And it’s not just the Dow that shows stocks hitting record highs.
You’ve probably heard of the S&P500.
It’s a broader index of 500 US stocks.
And it also touched its highest ever level earlier this week at 2,800.
And you get the same picture around the world…
Germany’s equivalent of the Dow, the DAX, is within a couple of hundred points (less than 2%) of its all-time high from November.
The Australian market took out record highs earlier this month.
The Japanese Nikkei is at its highest level for 27 years.And here in the UK, the FTSE 100 is within spitting distance of its best-ever price.
Lumped together as a group, global stocks are on fire!
Bloomberg tells us that “the MSCI All-Country World Index is up 4.6 percent in 2018, the best start to a year since at least 1988…”
No wonder stock market investors are feeling complacent then, right?
Why wouldn’t they want to keep on emptying out their savings accounts and piling their cash into the market that keeps on giving?
And what about the guys who have been standing on the side lines watching markets going up and up…
Why wouldn’t they want to get in… rather than missing out?
Why shouldn’t they?
I’ll tell you why.
Because if you dig a little deeper, there are plenty of reasons why markets may not keep marching higher.
Check out this newspaper headline I’ve just seen…
“Stocks crash in rush to sell: Billions lost!”
OK, don’t worry, you’ve haven’t missed something!
That headline’s not from today.
It’s from an issue of a long defunct New York paper, the Brooklyn Daily Eagle, dated 24 October 1929.
But I mention it because we could soon be seeing headlines just like it… but in real time.
The signs are starting to appear…
There’s a little-known number used by market nerds to determine how expensive stocks are.
It’s called the Shiller CAPE ratio.
And according to a recent Investopedia article, the CAPE ratio is “now at a higher level than it was before the Great Crash of 1929, the Financial Times reports, adding that the only time the CAPE was even higher preceded the dotcom crash of 2000-02.”
In other words, stocks are very expensive.
That’s not to say they can’t get even more expensive, of course.
But the point is, if history is any guide, investors should be getting a little wary about putting more money into stocks when they’re trading at these levels.
But as we’ve seen, they’re not.
Investors are too relaxed about buying at current levels.
They’re complacent even.
You can tell that by looking at one of my favourite indicators that I harp on about from time to time in Monkey Darts.
I’m talking about the VIX.
NO FEAR!
To remind you, the VIX is a volatility index.
It’s lovingly known as the “fear gauge”.
That’s because it measures how much “insurance” traders are prepared to stump up to protect their portfolios.
If the VIX is high, it’s because people are scared and buying lots of options to hedge against a stock market fall.
And when it’s low, it’s like investors don’t care.
They’re not worried about stocks falling.
They’re half-asleep and dreaming of ever-rising stock portfolios.
Well right now, the VIX is not far off the lows…
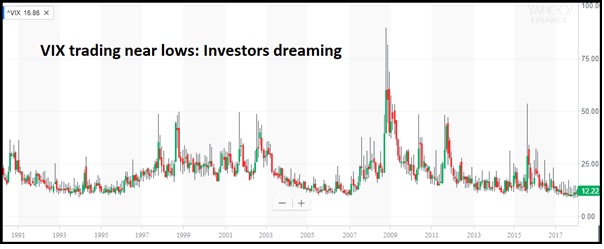
Fact is, with the VIX trading where it is now, investors see nothing but a positive future for stocks.
They don’t seem to have a care in the world when it comes to their investments – despite the ominous signs we’re seeing…
And if you ask me, that sort of complacency almost always gets punished.
Here’s an interesting point from CBSNews, referring to how the VIX behaved last week…
“The single most interesting development was that the CBOE Volatility Index (Wall Street’s “fear gauge”) rose in unison with stocks on Thursday and again on Friday – breaking the long-time inverse correlation between stocks and the VIX. That’s a potential regime change similar to the situation that marked the final stages of the last two bull markets — when both volatility expectations and stock prices rose together.”
Again, as with the CAPE ratio, it’s another little sign…
An echo of what happened during the death throes of previous bull markets.
And it gets worse…
This bet could turn bad
What’s scary about this situation is that traders have been loading up on bets to cash in on this low volatility environment.
Business Insider explains it here:
“Wall Street brokerages including Goldman Sachs, Deutsche Bank and Bank of America are warning that small traders have overextended positions in short VIX exchange-traded funds, meaning they’re betting volatility will remain low. This potentially sets the stage for a violent reversal as these short positions are closed.
“And it wouldn’t take much of a rise in the VIX to make that happen. An increase from around 10 to around 15 would force some $110 million in short-covering buying, according to JPMorgan’s head quant Marko Kolanovic. Goldman puts the tipping point at an increase of just 3.”
Hmmmm.
Since that article was written a couple of days ago, the VIX has edged up from 10 to 12.
So we’re just about at Goldman’s threshold and not far from JPMorgan’s.
If they’re right and we see a huge and rapid unwinding of these short volatility positions… and a switch to short stock trades….
Could this trigger the start of a major correction in the indices?
We’ll have to wait and see…
But wait, there’s more historical reckoning to be done here…
Market is now “historically stretched”
There’s another technical indicator that’s currently at levels previously seen just before major market corrections.
A lot of readers will have heard of the “relative strength index” or RSI.
Without getting into a complex explanation, it measures when an asset or a market is overbought (expensive) or oversold (cheap).
And according to Morgan Stanley boffins, right now the RSI on the S&P500 index is massively overbought.
Morgan Stanley says it’s “the most stretched it’s been in 20 years… In fact, the measure’s current reading of 93 is the second-highest since 1928.”
To give you a little context, any reading of above 70 on the RSI is considered overbought.
And apparently the S&P RSI has been above 80 for most of the last year.
But now it’s above 90, it’s not simply overbought.
It’s historically stretched.
When I’ve got my trading hat on, I look for overbought RSI levels as one of the pieces of evidence pointing to potential ‘short’ trades (i.e. trades where I’m betting on a falling price).
It’s not enough on its own to make me trade.
But with a very overbought RSI, I’d be looking for a catalyst for a falling market.
It all adds to the case…
The S&P is looking overstretched.
The fact is, right now most people aren’t thinking like this.
Prepare for the coming crash
People are not worried about the current market levels and whether they are overbought.
They’re taking it for granted that stocks are going higher.
And it could well be that this complacency is a sign that the market is overdue a substantial correction – perhaps even a crash.
What’s going to cause a sell-off, we don’t know.
Another US rate hike… poor corporate earnings… a VIX spike… a deterioration in international relations (Trump/Putin/Jong-un)…
So much to choose from!
So much that people should be thinking about… but aren’t!
There’s a very real risk that stock markets could shock us out of our complacency.
And so I think it makes sense to be ready for that.
I’m not saying you should head straight to your portfolio and hit ‘sell’ across the board.
But I wouldn’t be going all in on stocks right now.
If there’s a bunch of stocks you’ve been thinking of buying, now might not be the best time to load up…
You may well be able to pick them up cheaper in the not-too-distant future.
And make sure you’re diversified, too.
Spread your risk
Long-time Monkey Darts readers will recall that we’re fans of precious metals, gold and silver.
If you’ve read the report we put together on silver, you’ll know that we believe it’s due for a major move higher. If you haven’t read it just download it here (it’s free for my Monkey Darts readers)
In short, the price has been suppressed for years in a bank conspiracy.
But sooner or later, they won’t be able to contain the price.
And if there’s a shock move in the stock market, it could well lead to a spike in the silver price as traders reverse their short positions and buy the metal in huge quantities.
If you want to spread your risk a little away from the stock market, then both silver and gold are great assets to consider.
As for crypto currencies, no change there.
It’s still a market of huge potential.
You just need to be able to stomach the kinds of moves we’ve seen this week.
I’ll be back next Friday – have a great weekend.