

Imagine you’re desperate to buy a painting at an exhibition that ends today.
But you don’t have the £500 it costs until you get paid on Friday.
I might be happy to lend you the £500 if you like.
And you can pay me back on Friday. It’s just one day – I wouldn’t want anything in return.
But if you wanted to borrow that money for six months, I might want a little bit of interest on top.
To compensate me for not being able to use that money for myself. And for the risk I’m taking in lending you the money – I might not get it back!
It’s not a great example. After all, if you decide not to pay me back, what use is the proposed added interest?!
But it’s just a way to illustrate that in real life, money has a cost. And that cost varies with time.
Look at it another way.
Let’s say you have a lump sum of money to invest.
But you don’t want to put it into the stock market or anything high risk…
Just somewhere that it will earn enough interest to beat (or offset) inflation… and give you your capital back at the end.
So, a savings account or fixed-term bond, for example.
How much you’ll make depends on how long you sock your money away.
Getting paid for the risk you take
The rule of thumb is that the longer your money is tied up, the better rate of interest you’ll earn on it. That’s the cost you charge to whoever you’re lending your money to.
Committing it for two or three years will earn you more than you’ll get on an instant-access account.
Which makes sense.
After all, the longer your money is locked up, the greater the risk that you won’t get it back… or that it won’t keep up with rising inflation.
So, the quid pro quo, the pay-off, is a juicier return on your savings.
And it’s the same in the huge market for government bonds.
Or at least, it is usually…
Helping build Britain
These bonds, which we call ‘gilts’ in the UK, are government debt instruments.
When investors buy gilts, they’re lending money to the government.
It’s money the government needs to finance things like infrastructure or building projects.
The loan is for a set period, for example 2 years, 5 years or 10 years.
And at the end of the term of the bond (maturity), investors get their investment back.
In addition, in return for lending the money, they get a fixed cash payment or coupon paid every six months until maturity.
And typically, the longer the term of the bond, the higher the yield the investor will receive.
That’s for the same reason I mentioned before: the higher risk of rising inflation, the higher the yield to compensate.
But that’s in normal times.
It’s not always the case.
Something unusual in the bond market
In fact, something different, something unusual, is happening right now in America and here in the UK, too.
It’s been in the financial news this week… and it caused carnage in the stock market.
And it’s an ominous sign that there could be far more trouble ahead.
In the US, government bonds are known as treasuries.
And on Wednesday the yield on short-term treasuries moved higher than that on longer-term ones.
In other words, the US government was paying more to investors lending it money for two years than those lending for 10 years.
And the same thing happened for UK gilts, too.
This makes no sense.
It’s a phenomenon that doesn’t occur that often. But when it does, it points to bad times ahead for the economy.
It’s a sign that investors are worried about the immediate economic future. They are selling short-term bonds (sending the price down) and buying longer-term bonds (sending the price up).
That has the effect of pushing the yields on short-term bonds up, and on long-term bonds down. (Bond yields move in the opposite direction to bond prices.)
And at the same time, it spooks investors in stock markets.
That’s because they sense that if the economy weakens, there’s trouble ahead for companies, for company profits… and for their shares.
Stock markets sell off as the yield curve inverts
If you’ve had an eye on the markets, you’ll have seen the big sell-off on Wednesday.
The Dow Jones ended 800 points or -3.05% down on the day. It’s one of the worst days of the year so far for US stocks.
Asian stock markets such as the Japanese Nikkei followed suit overnight, falling 3.25%.
And European markets were dragged down, too.
It’s all down to something known as an ‘inverted yield curve’.
The yield curve is a visual representation of how yields on bonds tend to be higher the longer the bond term is.
So, it shows the price of borrowing money in the bond market.
You can get the idea from this graphic:
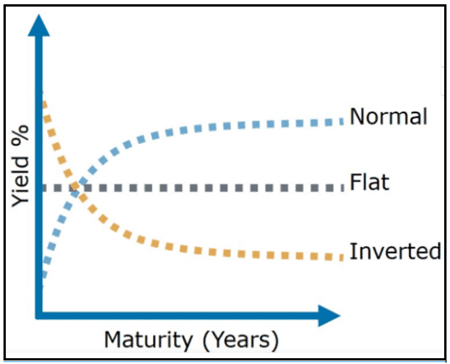
The blue dotted line is how it should be: the normal yield curve.
It shows yield increasing as the time to maturity of the bond goes up.
The grey dotted line shows when yields are the same, or similar, no matter the maturity.
And the yellow dotted line illustrates when yields are lower, the longer the bond.
An early warning of the coming recession
That’s not normal at all. That is the inverted yield curve and it’s not a good sign.
CNBC picks up the story:
“An inverted yield curve marks a point on a chart where short-term investments in U.S. Treasury bonds pay more than long-term ones. When they flip, or invert, it’s widely regarded as a bad sign for the economy.”
According to John Authers in Bloomberg’s Points of Return blog, historically, “yield inversions have been reliable early indicators of a recession”.
Every time there has been an inversion between 3-month US treasury bills and ten-year Treasuries since 1960, it has been followed by recession.
An inversion between 2-year and 10-year notes, is equally alarming.
And that’s what happened on Wednesday, where the 10-year yield dipped 2.1 basis points below two-year yields.
According to data analytics firm, Refinitiv, it’s the first time that’s happened since 2007, before the Global Financial Crisis and stock market collapse.
Meanwhile, the FT reports that the yield on the US 30-year Treasury fell below 2 per cent for the first time ever.
The FT explains why:
“Investors sought safety amid growing fears over the global economy and renewed trade tensions.
“Traders have dumped riskier assets such as stocks and crude oil and moved into perceived havens assets including bonds, driven by a growing list of interconnected fears including trade tensions between the US and China and slowing global growth.
“There is no doubt that the recession risk is rising amid further escalation of trade conflicts,” strategists at BNP Paribas said.”
The beginning of the end of the bull?
Now, it’s not to say that recession is right around the corner.
And it doesn’t mean that stock markets are about to fall off the cliff, even after a 3% fall on Wednesday. They could rally some more…
But it’s another warning sign. Perhaps the beginning of the end of this 10-year bull market.
And it’s a reason to be cautious about your investment decisions.
Investors are already worried that the dragging US-China trade war… and the chances of an escalating currency war on top – will trigger a worldwide recession.
That fear has been building for months… and we’ve been tracking it here in Monkey Darts.
As a result, investors are nervous… skittish, even.
It’s why with the slightest bit of bad news, markets can lurch suddenly lower, as we saw this week.
And with the slightest bit of good news, they can shoot higher.
But there is a sense that the mood among investors is darkening.
Gennadiy Goldberg, an interest rate trader at TD Waterhouse agrees:
“People are becoming more convinced that global growth is weakening and people are starting to see some signs of transmission into U.S. sentiment.
“That longer-end rates are rallying does suggest some lack of confidence that the central banks will actually be able to do anything about the slowing global growth momentum.”
It looks like we can expect further volatility ahead for stock markets.
I wouldn’t rule out some intervention at some point from policy makers and politicians.
Donald Trump, for example, has already launched another vicious attack on Jay Powell, head of the Federal Reserve.
He tweeted on Wednesday:
“Spread is way too much as other countries say THANK YOU to clueless Jay Powell and the Federal Reserve. Germany, and many others, are playing the game! CRAZY INVERTED YIELD CURVE! We should easily be reaping big Rewards & Gains, but the Fed is holding us back. We will Win!”
More sleepless nights for poor old Jay!
Trump can’t afford the Dow to crash – not when he’s trying to get voted in for a second term next year.
So, perhaps we’ll see him squeeze the Fed to take more drastic action soon… trying to prop up the economy and keep markets going.
But will it work? Or is it all too late?
We’ll have to wait and see.
Gold hits 20-year highs
Meanwhile, gold and silver are still in the ascendancy… as investors continue to de-risk and spread their wealth into other traditionally ‘safe’ assets.
For UK investors, that’s been particularly rewarding as the pound comes under continued pressure due to Brexit fears.
Tom Tragett, currency strategist at SocFin, writes:
“Gold priced in GBP has undeniably been one of the best trades of 2019 and certainly so in the third quarter. Since basing at around £970 an ounce back at the beginning of May the price has risen almost 30%, to trade close to £1,250 an ounce, reaching a high of £1,249.10 in the early hours today.”
Looking at the charts, that’s the highest gold has been in sterling terms for more than 20 years.
And if global macroeconomic problems persist, at the same time as Brexit fears continue to weigh on sterling, there could be further upside to come on that trade.
Regardless, diversified asset allocation has never looked like such a good idea as it does right now.